Farm businessFood and rural economy
What drives farmland values in Canada, and why rent tells a different story
Canadian farmland has risen in value for decades. How Farm Credit Canada measures it, what pushes prices up, and why rents and returns lag behind land prices.
 By Reid Gauthier9 min read
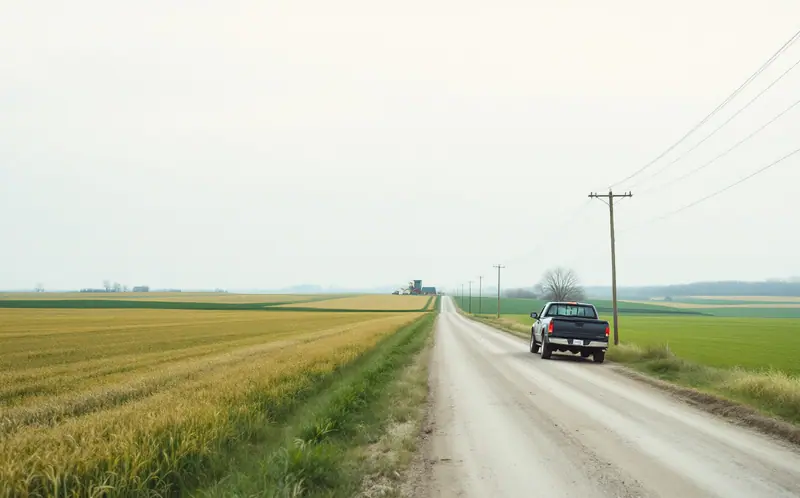
Every few weeks in a prairie town, a quarter section comes up for sale and the coffee shop talks about nothing else for a day. Who bid, who did not, and what the price says about everybody else's land. Farmland is the largest asset on most Canadian farm balance sheets, so its price matters well beyond the buyer and the seller. It sets how much equity a farm can borrow against, how much a retiring couple can count on, and how hard it is for a young farmer to get started.
This piece looks at how farmland values are measured in Canada, the forces that push them up or hold them back, and the relationship between land prices, rents and what the land actually earns. It explains the economics. It does not say whether anyone should buy, sell or hold land, and nothing here is a forecast.
How the numbers are measured
The figure most people quote comes from Farm Credit Canada, the federal Crown corporation that lends to agriculture. Each year FCC publishes a Farmland Values Report that tracks the average change in the value of cultivated farmland, by province and by region within the larger provinces. In general terms, the method follows a fixed set of benchmark properties and values them each period against recent comparable sales in the area. Because the same benchmark parcels are followed over time, the report measures the change in value of similar land, rather than the average price of whatever happened to sell that year. A year in which only the best land sold would otherwise look like a jump in prices.
Two limits are worth keeping in mind. The report covers cultivated land, so pasture, bush and irrigated parcels can move differently. And where there are too few public sales, as in Newfoundland and Labrador and the territories, FCC does not publish a figure at all.
What the most recent full year showed
FCC's report on 2024, released in March 2025, put the national average gain in cultivated farmland values at 9.3 per cent, down from 11.5 per cent in 2023. The provinces were far apart.
| Province | Change in 2024 |
|---|---|
| Saskatchewan | 13.1% |
| British Columbia | 11.3% |
| New Brunswick | 9.0% |
| Quebec | 7.7% |
| Alberta | 7.1% |
| Manitoba | 6.5% |
| Nova Scotia | 5.3% |
| Ontario | 3.1% |
| Prince Edward Island | 1.4% |
Source: FCC news release on 2024 farmland values.
What makes 2024 interesting is the context. FCC estimated that receipts from the main field crops fell by 11.8 per cent that year, because grain, oilseed and pulse prices were lower even though production rose. Land values still went up. That apparent contradiction is the best way into the question of what drives them.
The forces behind the price
What the land earns
At bottom, a field is worth what it can produce, for many years, discounted back to today. Crop receipts, livestock returns and the cost of inputs all feed into that. A run of strong crop prices, as in the years around 2021 and 2022, puts cash in farmers' hands and raises their sense of what land can earn. But land markets react slowly. A single poor year rarely knocks values down, because buyers are paying for decades of crops, not one harvest. That is part of why values kept rising in 2024 even as receipts fell.
Interest rates
Interest rates enter twice. First, they set the cost of financing a purchase. Second, they set the return a buyer could earn on other uses of the same money, which changes how much a stream of farm income is worth today. When rates fall, both effects push land values up. When rates rise, as they did sharply in 2022 and 2023, the cost of carrying land rises and the pressure runs the other way. FCC pointed to lower borrowing costs in 2024 as one reason prices kept climbing. The Bank of Canada began lowering its policy rate in June 2024 and continued cutting through 2025.
The neighbours
Farmland is not a national market in the way wheat is. Most parcels are bought by farmers who already farm nearby, because they can run the extra acres with the machinery, labour and bins they already have. To an expanding neighbour, one more quarter spreads fixed costs over more acres, so it is worth more than its stand-alone return. When two or three established operations want the same piece, the price reflects the most eager of them.
Supply matters as much. Very little land changes hands in any one year, often only a small fraction of a per cent of a municipality's acres. FCC cited limited land for sale as a support for prices in 2024. Many owners keep land for life, rent it out in retirement, or pass it to the next generation, which narrows the market further. Our earlier piece on farm succession planning covers how those transfers are usually arranged.
Non-farm buyers
Not every buyer farms. Near cities, land is valued partly for its possible future use as housing, warehouses or country residences, and the price can drift far from anything crops could justify. Further out, investors, retired farmers and family trusts buy land to rent out. Water matters too: FCC noted that dry conditions on the Prairies made irrigated land scarce and in strong demand.
Rules on who can own land
Provinces decide who may buy farmland, and the rules differ widely. Saskatchewan's Farm Security Act limits people who are not Canadian residents, and entities that are not Canadian owned, to small holdings of about 10 acres unless the province's Farm Land Security Board grants an exemption. Amendments in 2015 brought pension plans and trusts under the same restrictions. Prince Edward Island's Lands Protection Act caps total holdings, at 1,000 acres for an individual and 3,000 acres for a corporation, with some allowances. Other provinces have their own limits on non-resident buyers.
Rules like these shrink the pool of bidders. They are designed to keep land in the hands of resident farmers, and they also tend to keep local prices more closely tied to farm returns than they would be in a fully open market. Whether that trade-off is worth it is a policy argument that each province has settled in its own way.
Rent-to-value: the ratio that shows the gap
If you want one number that shows how far land prices have run ahead of farm returns, look at the ratio of cash rent to land value. FCC calls it the rent-to-price ratio: the cash rent for an acre divided by the value of that acre.
Nationally, FCC put the ratio at 2.50 per cent for 2024, down from 2.52 per cent in 2023 and from 2.70 per cent in 2020. Put simply, a landlord renting out cultivated land in 2024 collected, on average, about $2.50 a year in cash rent for every $100 the land was worth, before property tax and other owner costs. In Saskatchewan and New Brunswick the ratio held steady, because rents caught up quickly with values. In most other provinces, rents barely moved while values rose, so the ratio fell.
A low ratio says that buyers are paying for something beyond this year's rent: expected growth in the land's value, the strategic worth of land next to their own, or simply security of tenure.
FCC's affordability work makes the same point from another angle. It found that 2024 was the least affordable year for newly purchased farmland since 1983, comparing the payments on newly bought land with what the land generates. Payments on the land farmers already own took about 11 per cent of farm cash receipts nationally, a record high, with Ontario the highest of the provinces.
A worked example: price, rent and returns
The numbers below are round and purely illustrative. They describe no real farm, and the same arithmetic gives different answers in different places.
Take a quarter section of 160 acres of cultivated land valued at $5,000 an acre, so $800,000 in total.
The landlord's view
Say it rents for $125 an acre in cash, which is a rent-to-value ratio of 2.5 per cent.
| Item | Per acre | Whole quarter |
|---|---|---|
| Cash rent received | $125 | $20,000 |
| Property tax and insurance (assumed) | $20 | $3,200 |
| Net cash to the owner | $105 | $16,800 |
| Net cash as a share of value | 2.1% | 2.1% |
A 2.1 per cent cash return is modest. The owner is also exposed to the value of the land moving up or down, which is not in this table.
The buyer's view
Now picture a farmer who buys the same quarter with 25 per cent down ($200,000) and finances $600,000 at an assumed 5.5 per cent over 25 years. The annual payment on a mortgage like that comes to roughly $44,700, or about $280 an acre. On top of that, the $200,000 down payment has a cost, because it could have earned something elsewhere. At an assumed 3 per cent, that is $6,000 a year, or about $38 an acre.
| Cost of controlling an acre for a year | Renting | Buying |
|---|---|---|
| Rent or mortgage payment | $125 | $280 |
| Cost of the money tied up in the down payment | none | $38 |
| Property tax and insurance | usually the owner's | $20 |
| Total annual cash cost | $125 | about $338 |
Part of a mortgage payment is principal, which builds equity rather than disappearing, so the comparison is not quite like for like. Even so, the cash gap is wide.
What the land earns
Suppose the crop on that acre returns $150 above seed, fertiliser, chemical, fuel, machinery and labour costs in an average year. That covers the rent with $25 left over. It does not come close to covering the cash cost of owning on borrowed money. Paying $5,000 an acre only makes cash sense if the buyer counts on some combination of a large down payment from existing equity, lower interest rates, better crops or a rising land value.
That is the arithmetic behind the FCC affordability figures. Established farms with a lot of paid-off land can spread a new purchase across their whole operation, and the average cost of all their acres stays manageable. A beginning farmer without that base faces the full $338 on every acre.
Why it matters beyond the buyer
High land values are good news for those who already own land and bad news for those who want to get in. Rising values increase farm equity, which in FCC's figures sits at around 85 per cent nationally, and that equity is what lets existing farms expand. The same rise makes it harder for new entrants, and pushes many of them toward renting. Renting, in turn, gives farmers more acres for less capital, which is one reason so much of Canada's cropland is now farmed by people who do not own it. The long trend toward fewer and larger farms is tied closely to these land economics.
Land values also matter to rural municipalities, which tax assessed value, and to retiring farmers, for whom land is often the pension. When a family sells or passes on a farm, the gap between price and earning power decides whether the next owner is a neighbour, a newcomer or someone who will rent it back out.
Reading the next report
When FCC's next annual report comes out, a few questions make the headline percentage more useful. Did crop and livestock receipts rise or fall in the same year? What happened to interest rates? Did rents keep pace, or did the rent-to-value ratio slip again? And was the gain spread across the province or driven by a few high-demand areas near cities or water? A rise in land values that runs well ahead of rents and returns tells a different story from one that moves with them, and the difference shows up first in the rent-to-value ratio. For more on farm finances, see the farm business issues page.

Reid Gauthier
Reid lives in Brandon, Manitoba, among grain elevators and feedlots. He writes about livestock and grain markets, feed costs and how prices are discovered.