
How food inflation is measured and forecast in Canada
Food inflation comes from a weighted basket, not a till receipt. How Canada measures grocery and restaurant prices, what moves them and how to read a forecast.
 By Navdeep GrewalFirst posted at this address on 5 min read
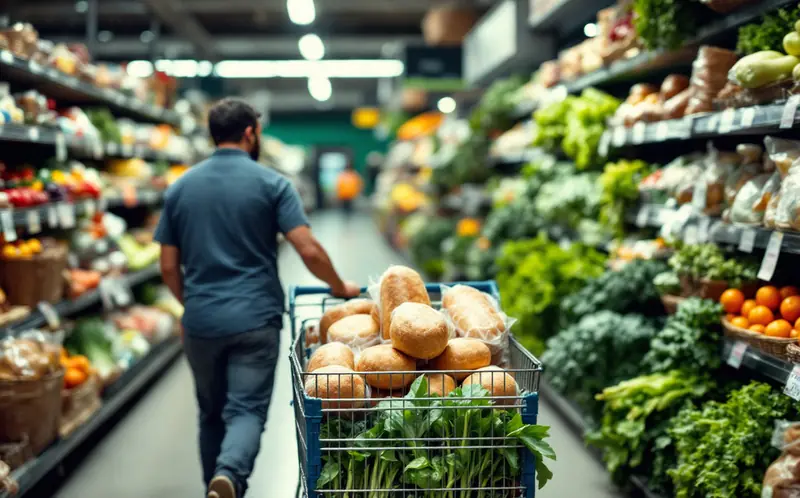
Every winter a handful of organizations publish a number for how much food prices will rise in the year ahead, and every month Statistics Canada publishes a number for how much they did rise. The two are often confused, and both are often compared with a shopper's own receipt, which almost never matches either. Understanding where the official figure comes from makes the forecasts much easier to read.
The basket behind the number
Statistics Canada measures inflation with the Consumer Price Index (CPI). The index tracks the cost of a fixed basket of goods and services that represents what Canadian households buy, priced every month. Food is one of the eight major components of that basket, alongside shelter, transportation, clothing and others.
Each item carries a weight that reflects its share of household spending. Those weights come mostly from Statistics Canada's Survey of Household Spending and are updated every few years. In the basket based on 2011 spending, food accounted for about 16.4 per cent of the whole CPI. Within food, roughly 11.5 points were food purchased from stores and about 4.9 points food purchased from restaurants.
That split matters because the two parts behave differently. Store prices move with farm and wholesale commodity prices, the exchange rate and grocery competition. Restaurant prices are driven more by wages, rent and other service costs, so they tend to rise more steadily and react less to a poor harvest.
A worked example: how weights shape the total
The figures below are illustrative and much simpler than the real index. Suppose a household's food spending is divided as follows, and suppose prices change over a year as shown.
| Item group | Share of food spending | Price change |
|---|---|---|
| Meat | 20% | +6% |
| Fresh vegetables | 10% | -4% |
| Dairy and eggs | 15% | +2% |
| Bakery and cereals | 15% | +1% |
| Other store food | 15% | +2% |
| Restaurant food | 25% | +2% |
The food inflation rate is the weighted average: 0.20 x 6, plus 0.10 x (-4), plus 0.15 x 2, plus 0.15 x 1, plus 0.15 x 2, plus 0.25 x 2. That works out to 2.05 per cent, even though meat alone rose by 6 per cent.
Two households can face very different experiences under the same index. One that eats a lot of meat and rarely goes out sees something closer to 4 or 5 per cent. One that buys mostly vegetables sees much less. The CPI describes the average basket, not any particular family's, which is why it so often feels wrong at the checkout.
What pushes food prices
Food prices respond to a long list of forces. The main ones are these.
- Farm commodity prices. Grain, oilseed and livestock prices feed into meat, dairy, bakery and oils, usually with a lag of months as the cost works through feed, processing and contracts.
- The exchange rate. Canada imports a large share of its fresh fruit and vegetables, especially in winter, and many of them are priced in US dollars. A weaker Canadian dollar raises their cost in stores.
- Energy. Fuel enters food prices through farm machinery, fertilizer, processing, refrigeration and trucking.
- Labour. Wages in processing plants, warehouses, stores and kitchens are a large share of the final price, especially for restaurant meals.
- Weather. Droughts, freezes and floods hit specific crops and regions, sometimes far from Canada, and show up quickly in fresh produce.
- Retail competition. The number and strength of grocery chains, new entrants and discounting affect how much of a cost increase is passed to shoppers and how fast.
Some of these push in opposite directions at the same moment. A fall in grain prices can be offset by a weaker dollar. A good domestic harvest can be swamped by a drought in a major exporting country.
Why forecasts differ
Food price forecasts are built from the same ingredients but mixed in different proportions. Forecasters differ on:
- Which commodity prices they expect and how long the lag to retail will be.
- Where they think the exchange rate is heading.
- How much they expect retailers to absorb costs in a competitive market.
- Whether they forecast all food, store food only, or a specific category such as meat.
- Whether the forecast is an annual average or a change from one December to the next.
That last point trips up many readers. An annual average compares the average index over twelve months with the average over the previous twelve. A December-to-December figure compares two single months. In a year when prices rise sharply late on, the two can differ by a full percentage point or more.
Reading a forecast sensibly
When a forecast says food prices will rise by, say, 2 to 4 per cent, the useful information is in the assumptions, not the number. A good forecast tells you which food groups it expects to lead, what it assumes for the dollar and commodities, and how its last forecast compared with the outcome. A range is more honest than a single figure.
It also helps to keep recent history in mind. By Statistics Canada's measure, prices for food in the CPI rose 2.4 per cent on an annual average basis in 2012. A forecast that departs far from recent experience should explain why.
Common questions
Does the CPI include food bought at restaurants and takeout counters?
Yes. Food purchased from restaurants is a separate subcomponent within food, covering table-service restaurants, fast food and takeout, and cafeterias.
Why do prices in my store seem to rise faster than the official number?
The index averages all households and all regions. Your basket may lean towards items that rose faster, and shoppers notice increases more than decreases. Package size changes also matter: when a product shrinks at the same price, the CPI tries to record it as a price rise, but shoppers may not notice it at all.
Is food inflation the same across the country?
No. Statistics Canada publishes the CPI for each province and for several cities, and food price changes can differ noticeably between them because of transport costs, local competition and provincial taxes on some items.
Does a forecast tell me what to expect at the checkout?
Only in broad terms. A forecast is a central estimate for the national average basket. Individual products can move far more, in either direction.
For a related question about why food can cost more on one side of the border than the other, see is food really dearer in Canada than in the United States?. Other writing on grocery prices and retail margins is collected under food prices and retail.